

IRCC releases updated breakdown of Express Entry candidates by CRS score
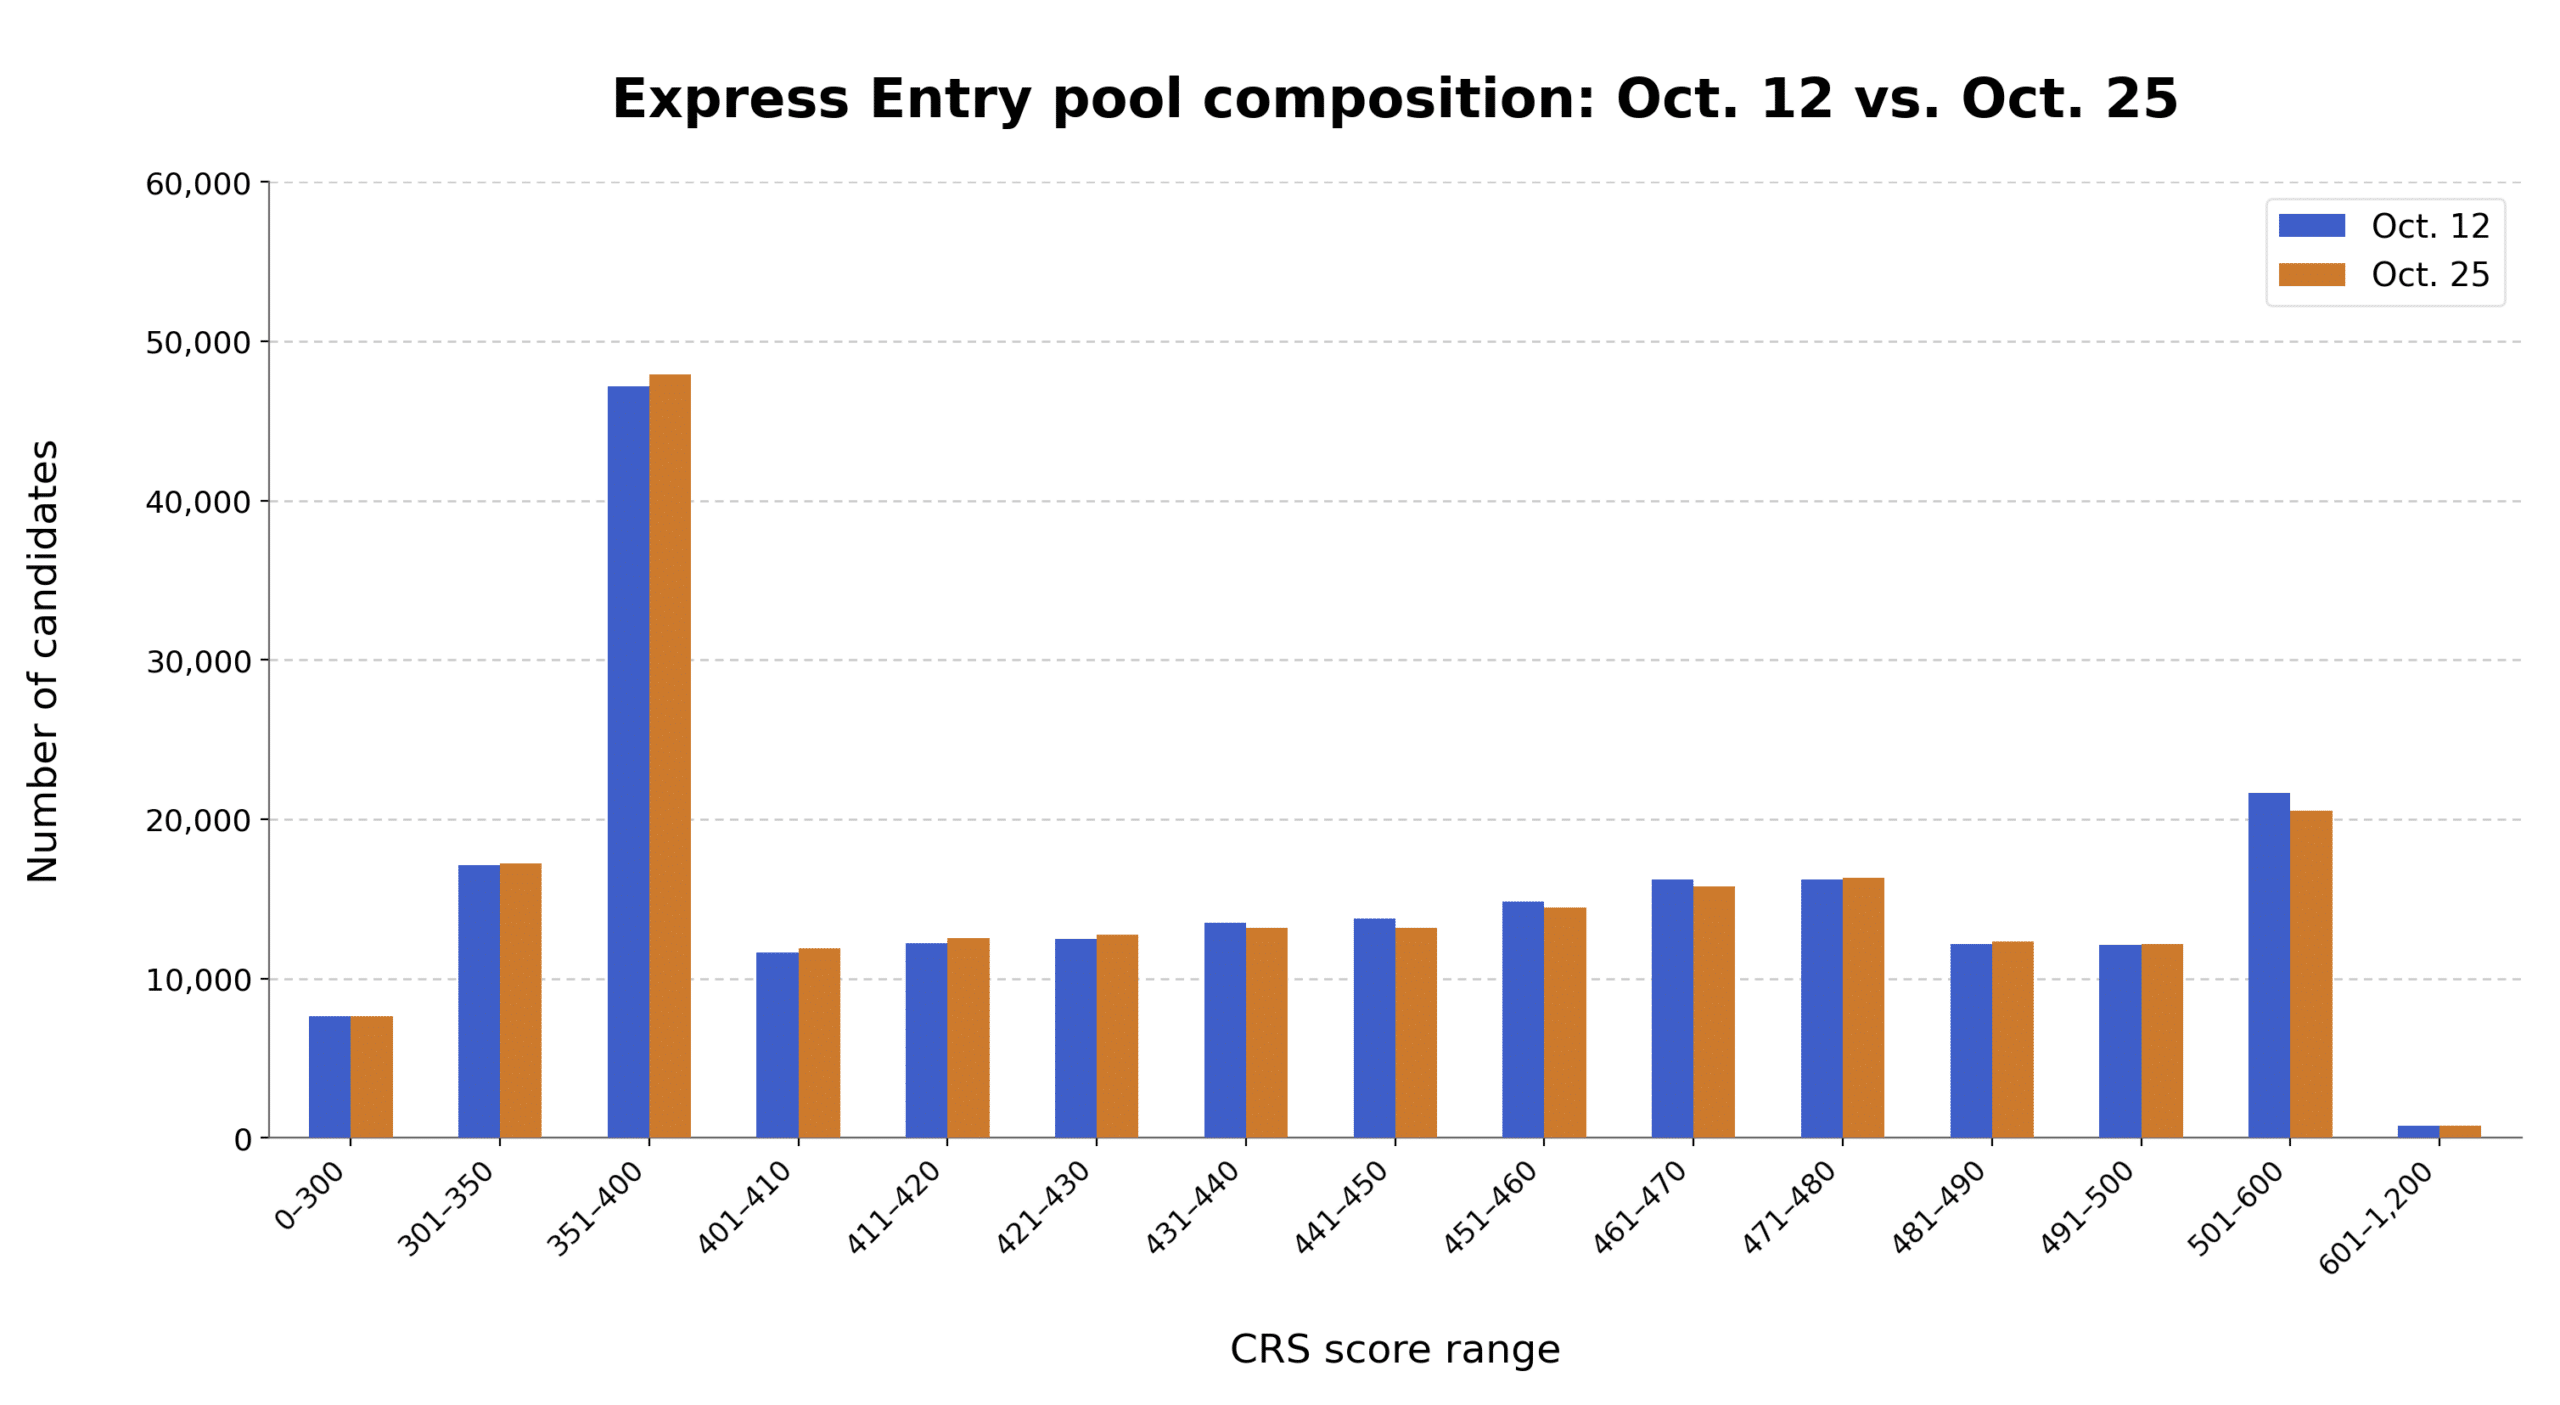
The Express Entry pool contracted by 732 profiles between Oct. 12–25, with the most significant declines occurring in the 431–470 and 501–600 CRS score ranges, according to the latest data released by Immigration, Refugees and Citizenship Canada (IRCC) on Oct. 26.
Despite the overall decline, the number of candidates scoring between 301–430 increased by 1,754.
See how competitive your Express Entry profile is
The following table provides a breakdown of the Express Entry pool by Comprehensive Ranking System (CRS) score range as of Oct. 25, compared with the previous snapshot from Oct. 12.
| CRS score range | Oct. 25 | Oct. 12 | Difference |
|---|---|---|---|
| 0–300 | 7,627 | 7,639 | −12 |
| 301–350 | 17,247 | 17,123 | +124 |
| 351–400 | 47,911 | 47,167 | +744 |
| 401–410 | 11,880 | 11,637 | +243 |
| 411–420 | 12,543 | 12,201 | +342 |
| 421–430 | 12,768 | 12,467 | +301 |
| 431–440 | 13,155 | 13,474 | −319 |
| 441–450 | 13,159 | 13,749 | −590 |
| 451–460 | 14,475 | 14,851 | −376 |
| 461–470 | 15,803 | 16,221 | −418 |
| 471–480 | 16,330 | 16,220 | +110 |
| 481–490 | 12,342 | 12,184 | +158 |
| 491–500 | 12,162 | 12,136 | +26 |
| 501–600 | 20,535 | 21,638 | −1,103 |
| 601–1,200 | 787 | 749 | +38 |
| Total | 228,724 | 229,456 | −732 |
The above data is also available in graph form:
How competitive is the Express Entry pool as of the latest data?
The table below shows how Express Entry candidates are distributed across CRS score ranges, alongside the percentile rankings corresponding to the upper and lower boundaries of each range
The calculations are based on IRCC’s latest available pool composition data, reflecting the distribution of candidates as of Oct. 25.
| CRS score range | Number of candidates | Cumulative | Percentile range | Percentage |
|---|---|---|---|---|
| 0–300 | 7,627 | 7,627 | 0.00%–3.33% | 3.33% |
| 301–350 | 17,247 | 24,874 | 3.33%–10.88% | 7.54% |
| 351–400 | 47,911 | 72,785 | 10.88%–31.82% | 20.95% |
| 401–410 | 11,880 | 84,665 | 31.82%–37.02% | 5.19% |
| 411–420 | 12,543 | 97,208 | 37.02%–42.50% | 5.48% |
| 421–430 | 12,768 | 109,976 | 42.50%–48.08% | 5.58% |
| 431–440 | 13,155 | 123,131 | 48.08%–53.83% | 5.75% |
| 441–450 | 13,159 | 136,290 | 53.83%–59.59% | 5.75% |
| 451–460 | 14,475 | 150,765 | 59.59%–65.92% | 6.33% |
| 461–470 | 15,803 | 166,568 | 65.92%–72.82% | 6.91% |
| 471–480 | 16,330 | 182,898 | 72.82%–79.96% | 7.14% |
| 481–490 | 12,342 | 195,240 | 79.96%–85.36% | 5.40% |
| 491–500 | 12,162 | 207,402 | 85.36%–90.68% | 5.32% |
| 501–600 | 20,535 | 227,937 | 90.68%–99.66% | 8.98% |
| 601–1,200 | 787 | 228,724 | 99.66%–100.00% | 0.34% |
A percentile indicates the proportion of Express Entry candidates with CRS scores at or below a given threshold.
Percentile rankings are presented as ranges to reflect the different standings possible within each CRS score bracket.
Which draws have not been factored into the Oct. 25 distribution?
The Oct. 25 Express Entry pool snapshot does not account for two draws held since that date, which collectively resulted in 5,792 invitations to apply (ITAs) for permanent residence.
| Date of draw | Round type | Invitations issued | CRS score of lowest-ranked candidate |
|---|---|---|---|
| Oct. 26 | Provincial Nominee Program | 792 | 761 |
| Oct. 27 | French-Language proficiency | 5,000 | 407 |
The Oct. 26 PNP draw recorded the highest invitation volume for this selection category since June 2026.
The two most recent draws bring IRCC’s total Express Entry invitations for 2026 to 149,259, with French-language proficiency draws accounting for the largest share of the year’s invitation volume, at approximately 40.2%.
What accounted for the changes in Express Entry profiles between Oct. 12 and Oct. 25?
During the Oct. 12–25 period, Canada’s immigration department conducted three Express Entry invitation rounds, issuing a combined 8,252 invitations:
| Date of draw | Round type | Invitations issued | CRS score of lowest-ranked candidate |
|---|---|---|---|
| Oct. 13 | Provincial Nominee Program | 752 | 772 |
| Oct. 15 | Canadian Experience Class | 2,500 | 519 |
| Oct. 16 | French-Language proficiency | 5,000 | 435 |
The Oct. 16 French-language and Oct. 13 PNP draws both recorded notable CRS cutoffs, reaching their highest levels since September 2025 and May 2025, respectively.
Upcoming Express Entry changes
Beginning Nov. 3, 2026, Express Entry candidates will be able to earn additional CRS points for Canadian work experience or qualifying job offers in high-wage occupations.
IRCC considers an occupation high-wage if its national median wage is at least 1.3 times the average median wage of the Canadian workforce, and has identified 186 eligible occupations across three wage levels: at least 1.3, 1.5 and two times the average median wage.
The points will be awarded under the new Labour Market Integration Factor (LMIF), which gives candidates the higher of two possible scores: up to 100 points for a qualifying job offer, or up to 150 points for Canadian work experience (up to 140 for candidates with an accompanying spouse or common-law partner).
Canadian work experience scores will include existing points for length of employment, plus up to 70 additional points for at least one year of experience in a high-wage occupation.
Qualifying job offers will be worth 50, 70 or 100 points, depending on the occupation’s wage level, reinstating CRS job offer points after their removal in March 2025.
Candidates will also no longer need a Labour Market Impact Assessment (LMIA) for a qualifying job offer to earn CRS points.
Under a temporary public policy, candidates invited to apply on or after Nov. 3 will also be exempt from LMIA requirements for qualifying job offers used to meet eligibility under the Federal Skilled Worker Program (FSWP) or Federal Skilled Trades Program (FSTP).
IRCC will temporarily pause Express Entry invitation rounds while it recalculates candidate scores under the revised system, a process the department says could take up to two weeks.