

IRCC publishes updated distribution of Express Entry candidate scores
The number of top-scoring candidate profiles in the Express Entry pool has fallen from 20,953 to 19,136, according to the latest data published by Canada’s immigration department.
See how competitive your Express Entry profile is
The most recent data was published on July 5, and compares as follows to the update published on June 21:
| CRS score range | June 21 | July 5 | Difference |
|---|---|---|---|
| 0–300 | 8,104 | 7,873 | −231 |
| 301–350 | 17,946 | 17,513 | −433 |
| 351–400 | 51,897 | 51,096 | −801 |
| 401–410 | 11,968 | 12,144 | +176 |
| 411–420 | 12,128 | 12,383 | +255 |
| 421–430 | 12,584 | 12,870 | +286 |
| 431–440 | 13,980 | 14,127 | +147 |
| 441–450 | 14,147 | 14,294 | +147 |
| 451–460 | 15,127 | 15,378 | +251 |
| 461–470 | 16,358 | 16,499 | +141 |
| 471–480 | 17,318 | 16,198 | −1,120 |
| 481–490 | 13,598 | 12,555 | −1,043 |
| 491–500 | 13,537 | 13,061 | −476 |
| 501–600 | 20,012 | 18,611 | −1,401 |
| 601–1,200 | 941 | 525 | −416 |
| Total | 239,645 | 235,127 | −4,518 |
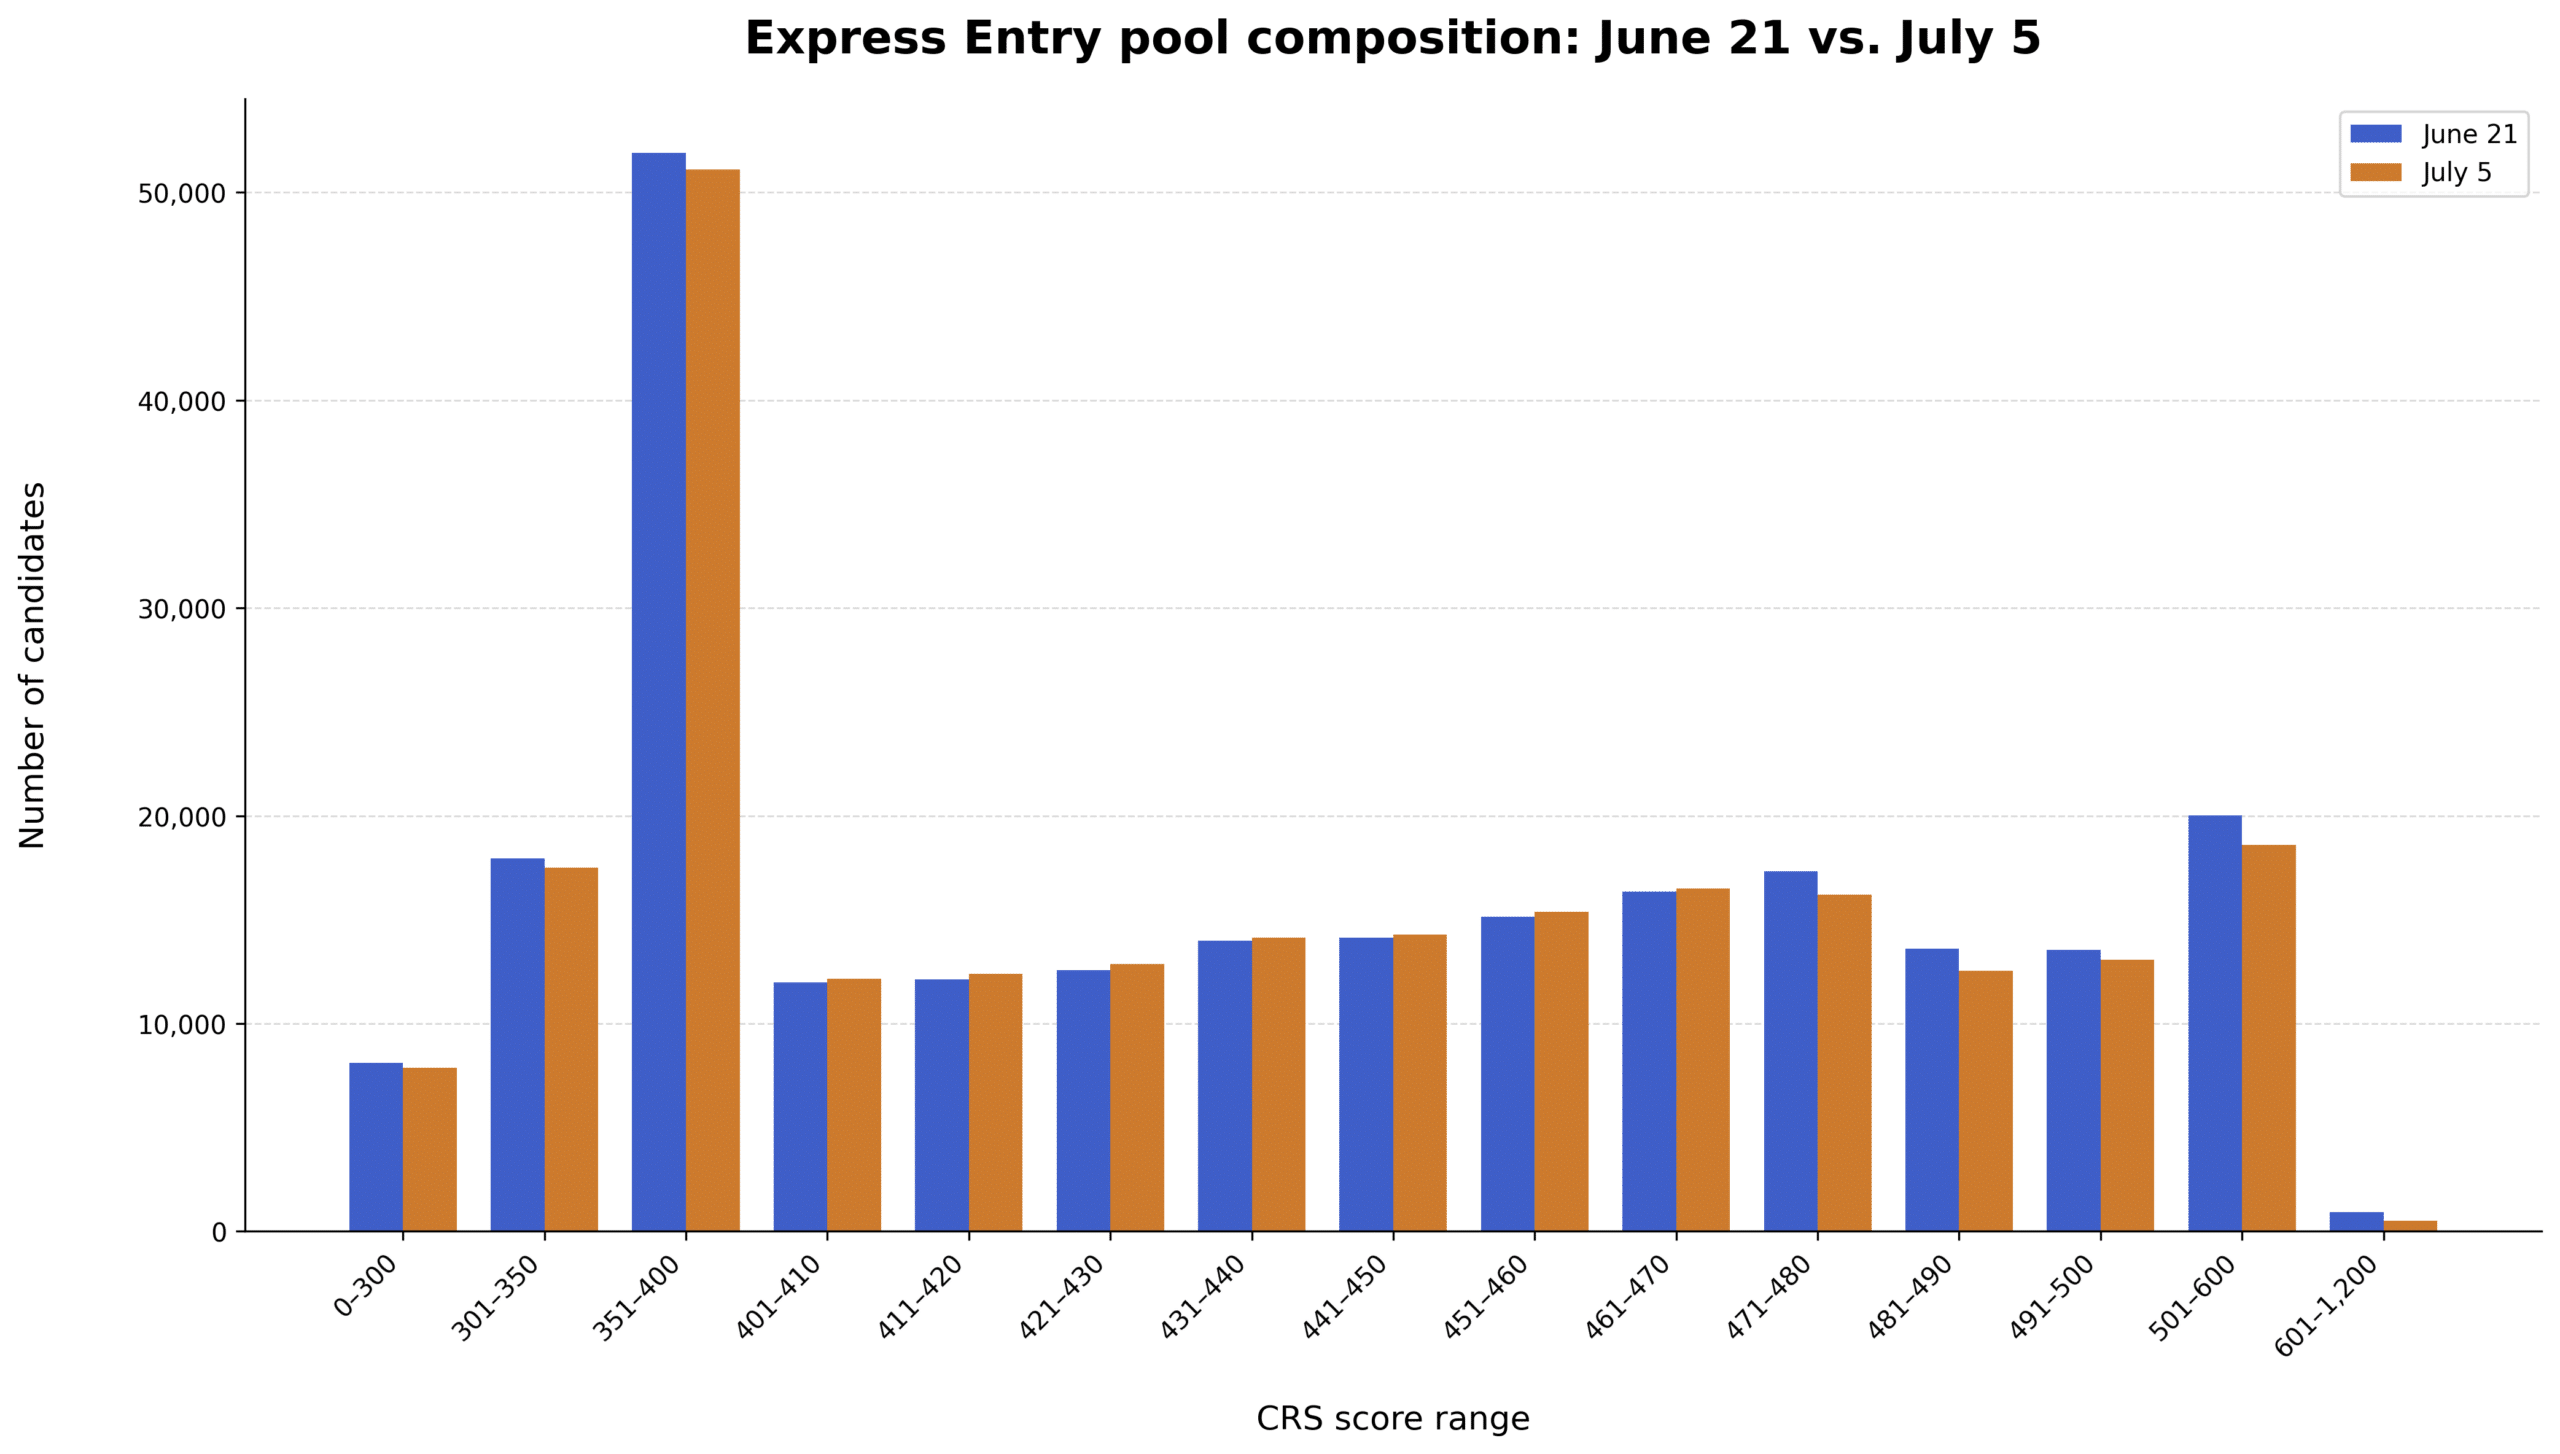
The chart below provides a visual comparison of these distributions:
How competitive is the Express Entry pool as of the latest data?
The table below illustrates the competitiveness of the Express Entry pool by comparing the percentage of candidates in each Comprehensive Ranking System (CRS) score range with the percentile ranges associated with the boundaries of those score bands.
These calculations are based on Express Entry pool data from July 5.
| CRS score range | Number of candidates | Cumulative | Percentile range | Percentage |
|---|---|---|---|---|
| 0–300 | 7,873 | 7,873 | 0.00%–3.35% | 3.35% |
| 301–350 | 17,513 | 25,386 | 3.35%–10.80% | 7.45% |
| 351–400 | 51,096 | 76,482 | 10.80%–32.53% | 21.73% |
| 401–410 | 12,144 | 88,626 | 32.53%–37.69% | 5.16% |
| 411–420 | 12,383 | 101,009 | 37.69%–42.96% | 5.27% |
| 421–430 | 12,870 | 113,879 | 42.96%–48.43% | 5.47% |
| 431–440 | 14,127 | 128,006 | 48.43%–54.44% | 6.01% |
| 441–450 | 14,294 | 142,300 | 54.44%–60.52% | 6.08% |
| 451–460 | 15,378 | 157,678 | 60.52%–67.06% | 6.54% |
| 461–470 | 16,499 | 174,177 | 67.06%–74.08% | 7.02% |
| 471–480 | 16,198 | 190,375 | 74.08%–80.97% | 6.89% |
| 481–490 | 12,555 | 202,930 | 80.97%–86.31% | 5.34% |
| 491–500 | 13,061 | 215,991 | 86.31%–91.86% | 5.55% |
| 501–600 | 18,611 | 234,602 | 91.86%–99.78% | 7.92% |
| 601–1,200 | 525 | 235,127 | 99.78%–100.00% | 0.22% |
The percentile figures show the proportion of candidates in the pool with CRS scores at or below the upper limit of each score range.
These percentiles are shown as ranges for clarity, as candidates within a given CRS bracket may fall between the two percentile values listed.
Which draws have not been accounted for in the July 5 distribution?
The July 5 distribution does not consider the two most recent Express Entry draws conducted by Immigration, Refugees and Citizenship Canada (IRCC) on July 6 and July 7, through which a combined total of 2,534 invitations were issued:
| Date of draw | Round type | Invitations issued | CRS score of lowest-ranked candidate invited |
|---|---|---|---|
| July 6 | Provincial Nominee Program | 534 | 708 |
| July 7 | Canadian Experience Class | 2,000 | 517 |
What accounted for the changes in Express Entry profiles between June 21 and July 5?
IRCC conducted four draws in the two-week span between June 21 and July 5, cumulatively issuing 9,226 invitations.
| Date of draw | Round type | Invitations issued | CRS score of lowest-ranked candidate invited |
|---|---|---|---|
| June 22 | Provincial Nominee Program | 955 | 730 |
| June 23 | Canadian Experience Class | 4,000 | 516 |
| June 24 | Physicians with Canadian Work Experience | 271 | 223 |
| June 25 | Healthcare and Social Services Occupations | 4,000 | 475 |
Over this period, the overall size of the Express Entry pool declined by 4,518 profiles.
Permanent residence selection through Express Entry
Express Entry is the federal government’s flagship application management system for the selection of permanent residents intending to settle in Canada outside Quebec.
The government periodically issues invitations to apply for permanent residence to top-scoring candidates with active profiles in the Express Entry system.
To enter the Express Entry pool, candidates must first meet the minimum requirements for one of the system’s programs. Their profile receives a CRS score based on factors including age, education, official language ability, and work experience.
The government also holds draws under category-based selection, in which it issues invitations only to candidates meeting the requirements for an identified priority economic category.
The current priority categories focus on French-language proficiency and work experience in select occupations tied to in-demand sectors, including healthcare and social services, trades, education, and transportation.